Med hänsyn till att historisk avkastning inte är en garanti för framtida avkastning:
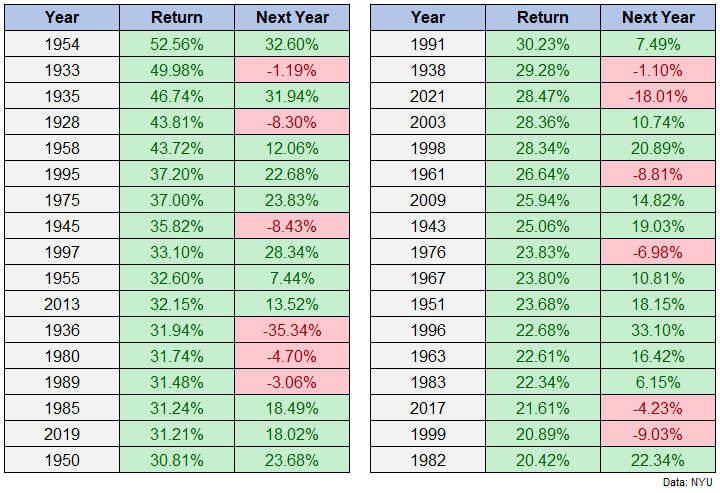
Here are all of the 20% up years along with the following year returns:
Not too bad. More green than red for sure. Here are the summary statistics:
The stock market was up 22 out of the 34 years following a 20% gain (65% of the time).
The stock market was down 12 out of the 34 years following a 20% gain (35% of the time).
The average return following a 20% up year was 8.9%.
The average gain was +18.8% in up years.
The average loss was -9.1% in down years.
There were 19 double-digit up years.
There were just two double-digit down years (1936 and 2022).
This year is teetering on the edge of another 20% up year. We’ll see if Santa comes through for us by the end of the year or not but so far so good.
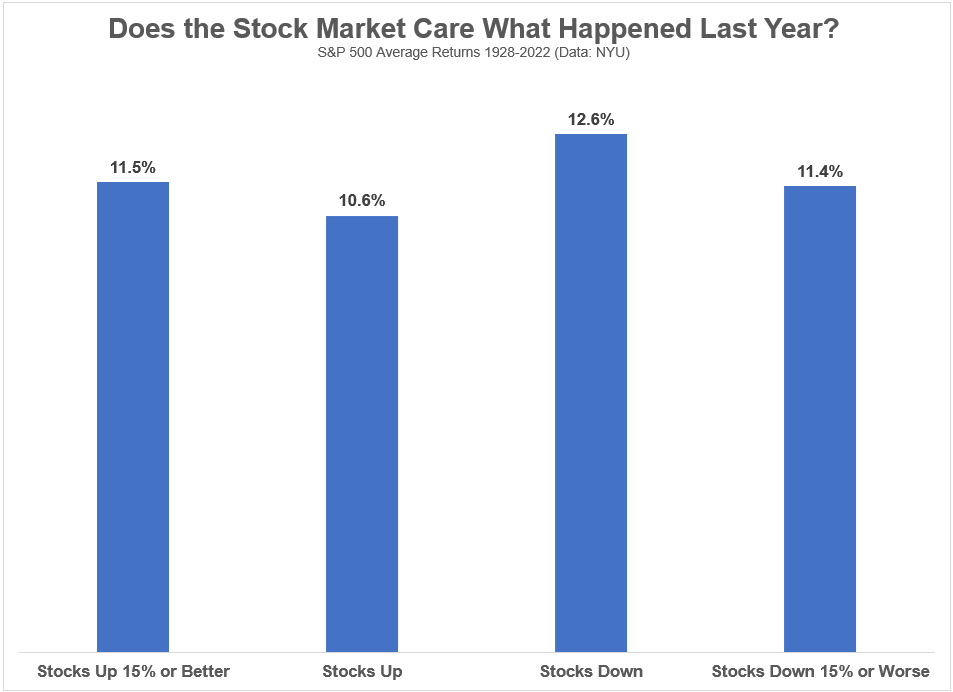
It’s also important to ask how much returns in one year actually impact returns in the following year. Here’s a look at average returns following a big up year, an up year, a down year and a big down year:
So maybe the 20% starting point matters less than one would assume.
I’m sure you could slice and dice the data to offer up some more signal but there doesn’t appear to be much correlation from one year to the next.
Most of the time stocks go up but sometimes they go down is about as good as you’re going to get.
It’s certainly possible the stock market has been pricing in Fed rate cuts for early next year. The S&P 500 isn’t going to wait around for Jerome Powell to spell it out. The inflation rate is falling, interest rates are falling, and wage growth is falling so it makes sense for the Fed to start cutting sometime in the first half of 2024.
Hur går det nästa år? Sätter du det med så är du expert och det är dig vi kommer lyssna på framöver, om inte så var det bara en slump, typ apan som kastar pil på vilken aktie som kommer gå bäst.
Det som händer är att man förhoppningsvis fortsätter månadsspara och tar tillvara på tiden utanför börsen och får med sig billigare fondandelar till senare i livet
 räknar i Riksdagen")