Ja man kan ju lika gärna tänka sig en period framöver där alla andra riskfaktorer än marknadsfaktorn överpresterar riskfri ränta, och en investerare känner sig lockad att gå all in FF3/FF5 ![]()
Jag känner mig personligen lite otrygg med endast marknadsfaktorn då det gått så relativt bra för den på sistone. Även om faktorerna är svåra att övervikta med hänsyn till kostnader och effektivitet.
Larry Swedroe argumenterar för att en högre tilt mot faktorerna med fördel kombineras med en lägre aktieexponering som helhet i en portfölj. För att på så vis uppnå högre diversifiering och skära bort svansrisker. Jag tycker det låter sunt, om det inte vore för vårat skrala utbud av bra fonder i Europa ![]() How to think differently about diversification | TEBI
How to think differently about diversification | TEBI
Från artikeln
The idea behind the “Larry Portfolio” is based on the academic research and historical evidence that small and value stocks have provided returns above the market — premiums (the size and value premium) that are unique (independent) of the overall risk of the market (referred to as market beta). Thus, they provide a diversification benefit. Those premiums (higher expected returns) allow you to have a lower allocation to risky stocks (because the stocks you own have higher expected returns) and thus a higher allocation to safe bonds. Historically, portfolios that have been “tilted” to these factors while reducing equity exposure have cut the left tail (and thus the dreaded sequence risk retirees face).
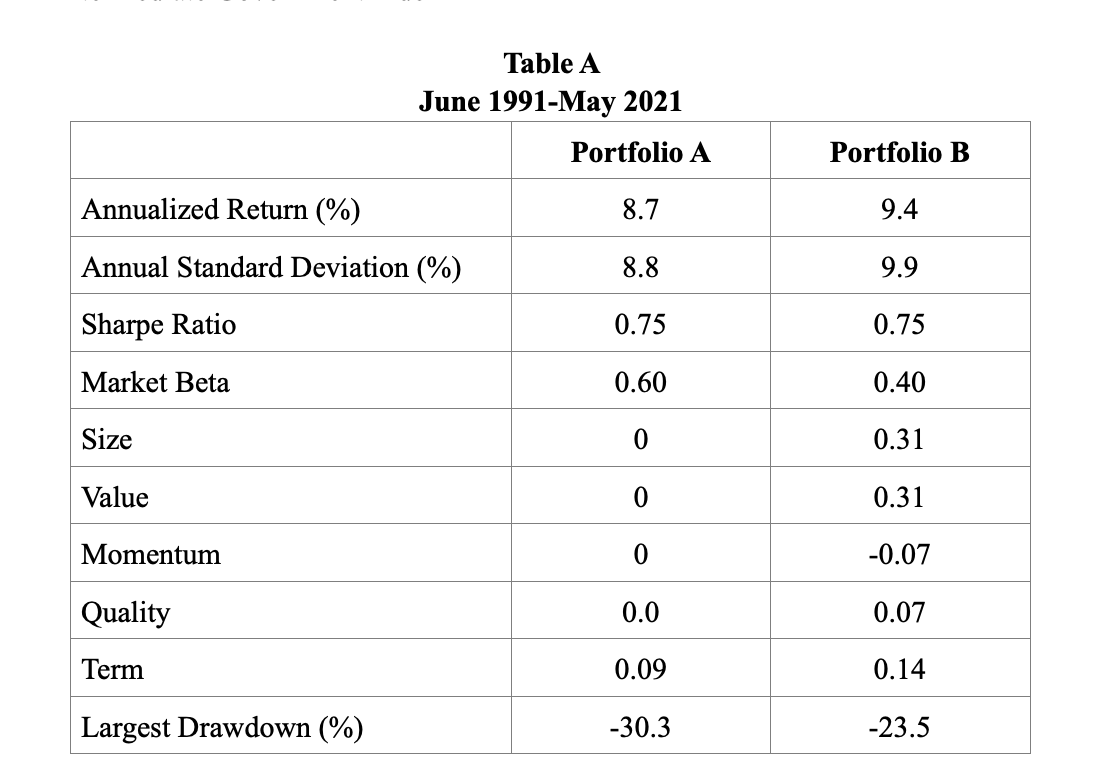
- Portfolio A: 60% CRSP 1-10 Index/40% Barclays Capital U.S. Intermediate Government Index
- Portfolio B: 40% Dimensional U.S. Small Cap Value Index/60% Barclays Capital U.S. Intermediate Government Index
Table A below provides an example of how the Larry Portfolio might be implemented and compares the strategy with that of the typical 60/40 portfolio using a market portfolio. We will examine the 30-year period from June 1991-May 2021.
Portfolio B produced a slightly higher return than Portfolio A but with slightly higher volatility. The risk-adjusted returns, as measured by the Sharpe ratio, were the same for the two portfolios, as Portfolio B’s higher return was offset by its higher volatility. However, Portfolio B experienced a much lower worst-case drawdown (-23.5 percent versus -30.3 percent). In other words, investors significantly cut the left tail risk, the main goal of the strategy, without negatively impacting the return or the risk-adjusted return. It’s worth noting that these results were achieved despite the fact that the value premium experienced its worst drawdown by far near the end of the period, and its second worst drawdown occurred around the turn of the century.
Såhär har det sett ut under riktigt sura börsperioder för SCV i USA.
1929-1943: The S&P 500 Index returned just 0.3 percent per annum versus the 0.7 percent return to one-month Treasury bills. During this period small value stocks, as measured by the Dimensional U.S. Small Cap Value Index, provided basically the same return, 0.1 percent.
1966-1982: The S&P 500 Index returned 6.8 percent per annum versus the 7.0 percent return of one-month Treasury bills. During this period the Dimensional U.S. Small Cap Value Index returned 16.0 percent a year, an outperformance of 9.2 percentage points a year for 17 years.
2000-12: The S&P 500 Index returned 1.7 percent per annum versus the 2.1 percent return of one-month Treasury bills and the 12.5 percent return of the Dimensional U.S. Small Cap Value Index, an outperformance of 10.8 percentage points per year for 13 years.