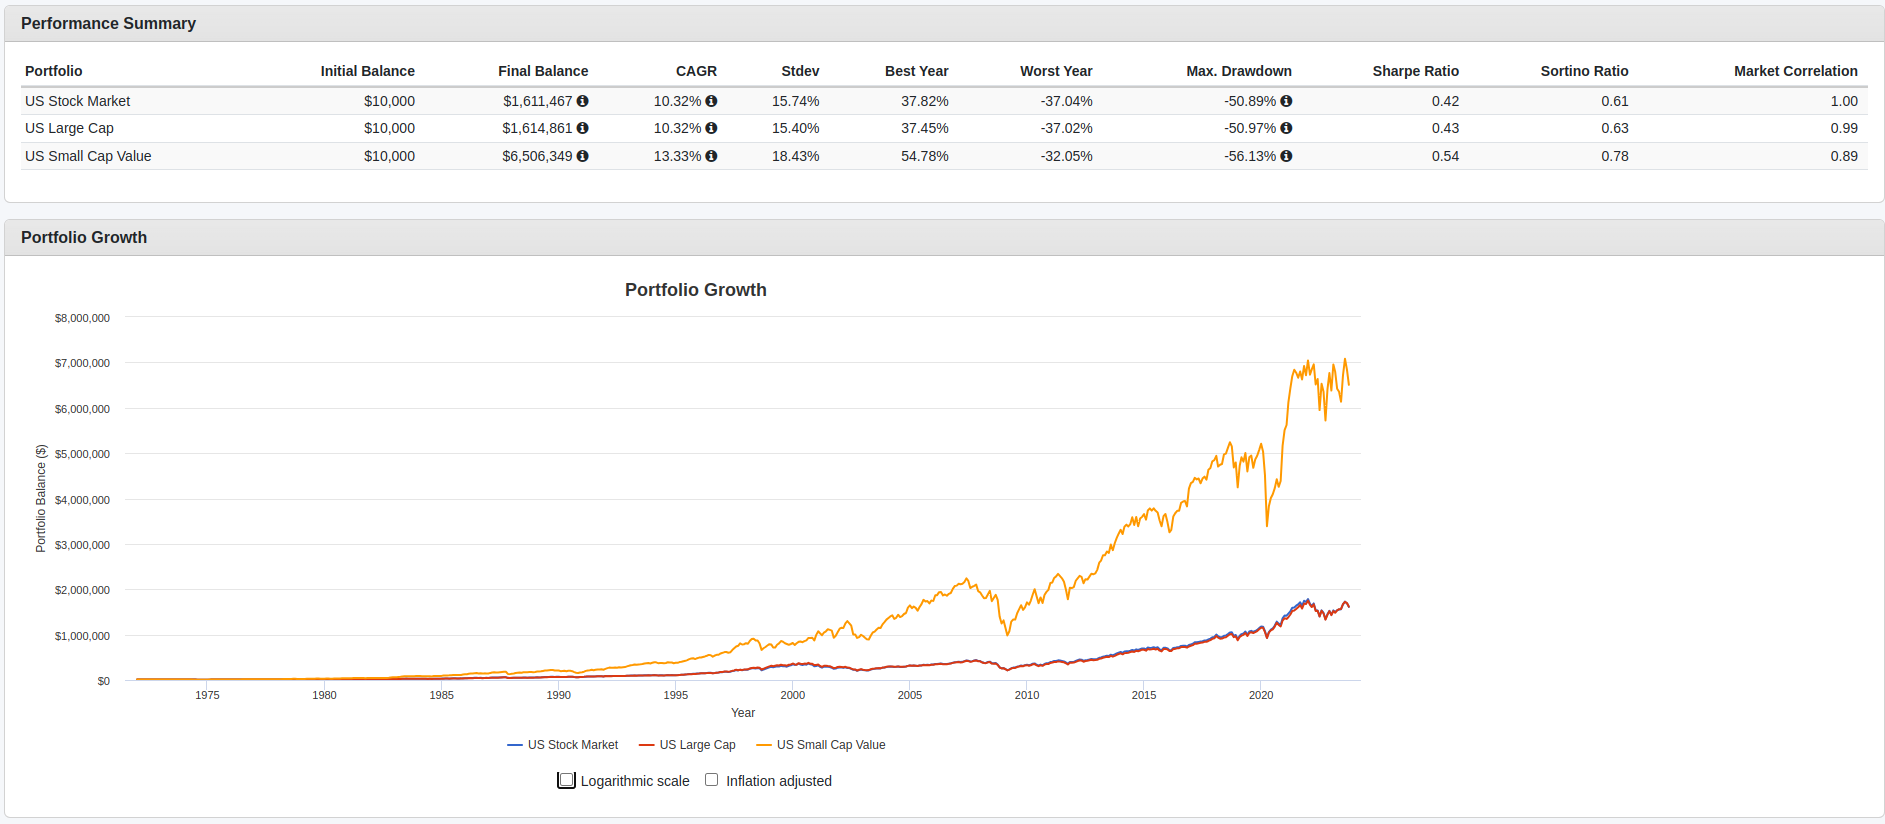
Min tolkning av denna är att man till marginellt högre risk kan få betydligt högre absolutavkastning genom att tilta mot SCV. Om detta stämmer, hjälp mig förstå varför jag inte skulle tilta en del av portföljen mot SCV (förutom beteenderisk och att man kan få vänta några år på överprestation).
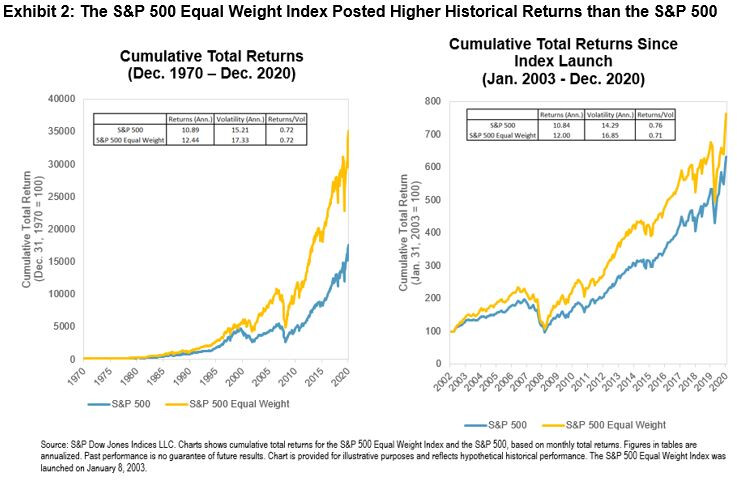
Denna har jag svårare för att tolka. (Verkar stå i kontrast till grafen som Jan publicerade ovan?) Är likaviktat ett bättre alternativ än marknadsvikt om man är ute efter absolutavkastning? Till hur mkt högre risk? Utifrån graferna har jag svårt att se att marknasviktat är ett självklart bättre alternativ än likaviktat, eller tolkar jag dem fel?
Och ni diskuterar om man bör övervikta detta index?
Jag tänker spontant att det bör vara samma princip som övrig bias. En ökad riskjusterad avkastning. Men är inte insatt.
Man får inte glömma att det är en sak att räkna på något och att faktiskt löpa linan ut. Även om det teoretiskt kan vara bättre på 10+ år. Så kan det vara svårt att stå fast vid sin teori i decennier framöver.
Jag håller mig till marknadsviktad index globalt. Buy and forget
1970-2020 visar att du får lika mycket avkastning per volatilitet oavsett om du kör jämviktat eller marknadsviktat. Men eftersom jämviktat har högre årlig volatilitet (med ca 14%) så blir den årliga avkastningen också högre (med ca 14%).
2003-2020 visar att du får något sämre avkastning per volatilitet om du kör jämviktat än om du kör marknadsviktat. Men eftersom jämviktat fortsatt har högre årlig volatilitet (med ca 18%) så ger det också fortsatt högre årlig avkastning (med ca 11%).
Om du är ute efter att maximera avkastningen per volatilitet så framstår alltså marknadsviktat som ett robustare alternativ än jämviktat, om vi enbart utgår från informationen från de två graferna. Om du däremot är ointresserad av volatiliteten och bara vill maximera avkastningen så framstår jämviktat så klart i bättre dager.
Ja precis, vi är nog tämligen överens på forumet att SCV ökar förväntad avkastning men till en högre risk (baserat på gedigen forskning). Men om det kan öka förväntad riskjusterad avkastning att addera SCV till en marknadsviktad portfölj är inte lika självklart, beroende på vad man tror på.
En utmaning med faktorerna är att vi vanliga småsparare har svårt att på ett billigt sätt exponera oss mot dem. I USA finns ETF:er som kan användas. Men jag upplever att de fonder vi har i Sverige träffar lite fel. Så utifrån en portföljdiskussion vore det intressant att veta hur exponering kan nås med vanliga fonder.
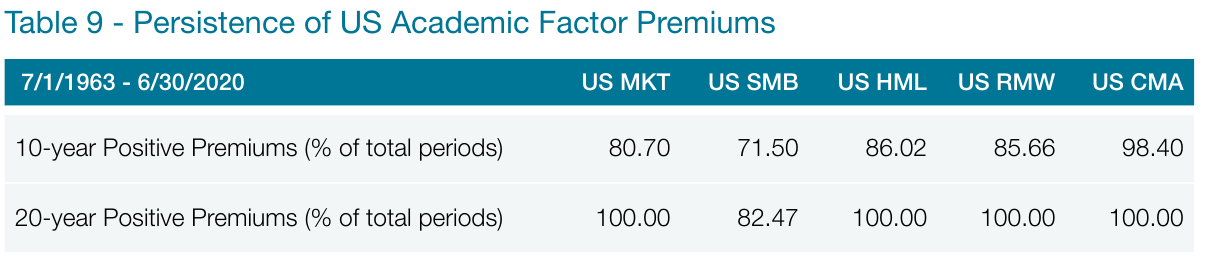
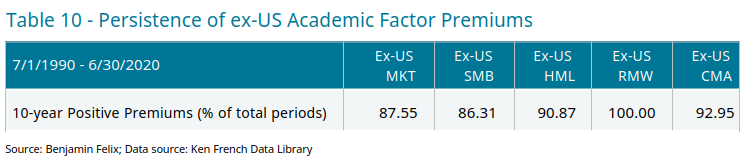
Några anteckningar från caset MOT faktortilt med SCV från Bogleheads-konferensen 2023 med Rick Ferri. De lovade släppa hela inspelningen vid tillfälle.
Market Beta, Additional Betas (factors), and Risk Premiums
Market beta explains most of the return of any diversified portfolio.
Additional factors (size, value, quality, price momentum) explain most of the rest (up to 18% of the return variability from beta).
The more weight to additional factors, the greater the tracking error to the market, which investors hope is positive (risk premiums).
Factor “titled” portfolios come with extra costs: higher management fees, additional trading. This creates a “hurdle rate” that must be overcome before any alpha is earned.
If the factor premiums are 0% (or less) during your time horizon, a factor tilted portfolio will underperform the market.
The only way to benefit is to remain disciplined for a long time and hope the factor premiums ultimately exceed the hurdle rate.
Factor tilts create more “behavioral risk” than holding the market because factor investing is about outperforming the market.
During 2000 to 2007, thousands cried, “Gotta have DFA funds!” and advisers pounced on the marketing opportunity.
Regression to the mean followed, and weak hands threw in the towel. This locked in their underperformance.
The performance-chasing mindset of most factor investors is left out of academic literature, but fund flow data shows it exists.
It’s easier to stay the course in a simple market portfolio. ~John Bogle
samt
Bottom line
You may be rewarded for including additional factors to your portfolio in the long-term, but premiums are not guaranteed.
The only guarantees are more risk, more cost, more complexity, and tracking error to the market that can result in permanent underperformance due to bad timing by investors.
If you are in, stay in. If you thinking of adding factors, limit your exposure to ~25% of your equity and stay the course, probably for LIFE, and that might not be long enough.
Remember, the most important decision we make as investors is our beta allocation - how much to invest in stocks, fixed-income, real estate, and cash, then let the markets take care of the rest.
Är det någon här som faktiskt har med small cap value i portföljen och i så fall hur mycket?
Jag har bara en väldigt liten andel men har många gånger funderat på att skruva upp mot 10-20%. Det lilla jag har nu gör nog varken till eller från egentligen…
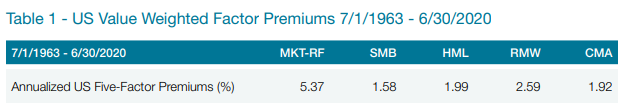
Ja man kan ju lika gärna tänka sig en period framöver där alla andra riskfaktorer än marknadsfaktorn överpresterar riskfri ränta, och en investerare känner sig lockad att gå all in FF3/FF5
Jag känner mig personligen lite otrygg med endast marknadsfaktorn då det gått så relativt bra för den på sistone. Även om faktorerna är svåra att övervikta med hänsyn till kostnader och effektivitet.
Larry Swedroe argumenterar för att en högre tilt mot faktorerna med fördel kombineras med en lägre aktieexponering som helhet i en portfölj. För att på så vis uppnå högre diversifiering och skära bort svansrisker. Jag tycker det låter sunt, om det inte vore för vårat skrala utbud av bra fonder i Europa How to think differently about diversification | TEBI
Från artikeln
The idea behind the “Larry Portfolio” is based on the academic research and historical evidence that small and value stocks have provided returns above the market — premiums (the size and value premium) that are unique (independent) of the overall risk of the market (referred to as market beta). Thus, they provide a diversification benefit. Those premiums (higher expected returns) allow you to have a lower allocation to risky stocks (because the stocks you own have higher expected returns) and thus a higher allocation to safe bonds. Historically, portfolios that have been “tilted” to these factors while reducing equity exposure have cut the left tail (and thus the dreaded sequence risk retirees face).
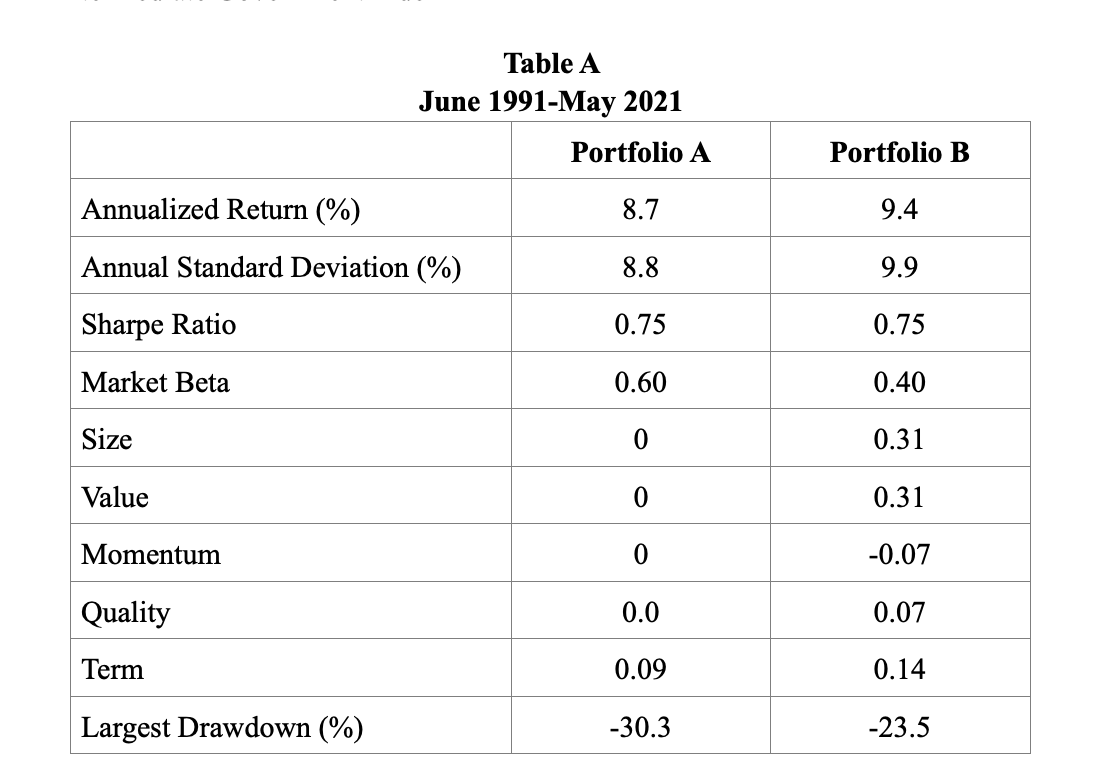
Portfolio A: 60% CRSP 1-10 Index/40% Barclays Capital U.S. Intermediate Government Index
Portfolio B: 40% Dimensional U.S. Small Cap Value Index/60% Barclays Capital U.S. Intermediate Government Index
Table A below provides an example of how the Larry Portfolio might be implemented and compares the strategy with that of the typical 60/40 portfolio using a market portfolio. We will examine the 30-year period from June 1991-May 2021.
Portfolio B produced a slightly higher return than Portfolio A but with slightly higher volatility. The risk-adjusted returns, as measured by the Sharpe ratio, were the same for the two portfolios, as Portfolio B’s higher return was offset by its higher volatility. However, Portfolio B experienced a much lower worst-case drawdown (-23.5 percent versus -30.3 percent). In other words, investors significantly cut the left tail risk, the main goal of the strategy, without negatively impacting the return or the risk-adjusted return. It’s worth noting that these results were achieved despite the fact that the value premium experienced its worst drawdown by far near the end of the period, and its second worst drawdown occurred around the turn of the century.
Såhär har det sett ut under riktigt sura börsperioder för SCV i USA.
1929-1943: The S&P 500 Index returned just 0.3 percent per annum versus the 0.7 percent return to one-month Treasury bills. During this period small value stocks, as measured by the Dimensional U.S. Small Cap Value Index, provided basically the same return, 0.1 percent.
1966-1982: The S&P 500 Index returned 6.8 percent per annum versus the 7.0 percent return of one-month Treasury bills. During this period the Dimensional U.S. Small Cap Value Index returned 16.0 percent a year, an outperformance of 9.2 percentage points a year for 17 years.
2000-12: The S&P 500 Index returned 1.7 percent per annum versus the 2.1 percent return of one-month Treasury bills and the 12.5 percent return of the Dimensional U.S. Small Cap Value Index, an outperformance of 10.8 percentage points per year for 13 years.
Det är ju så @Zino gör med sin allvädersportfölj. Ingen marknadsviktad aktiefond, utan olika icke-korrelerade faktorer (speciellt värde och momentum), för att maximera förväntad avkastning och ombalanseringseffekt.
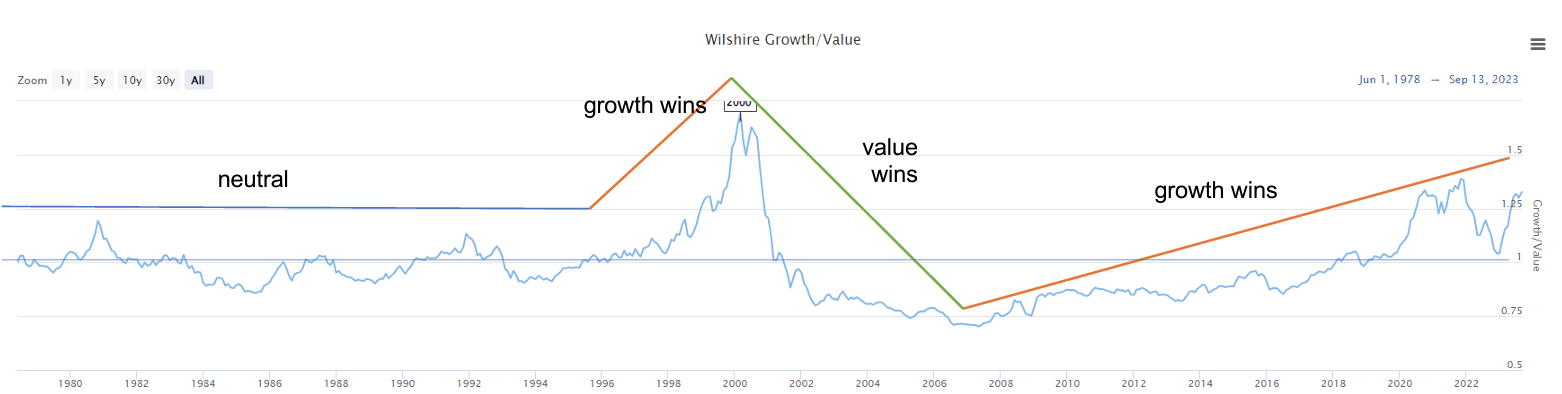
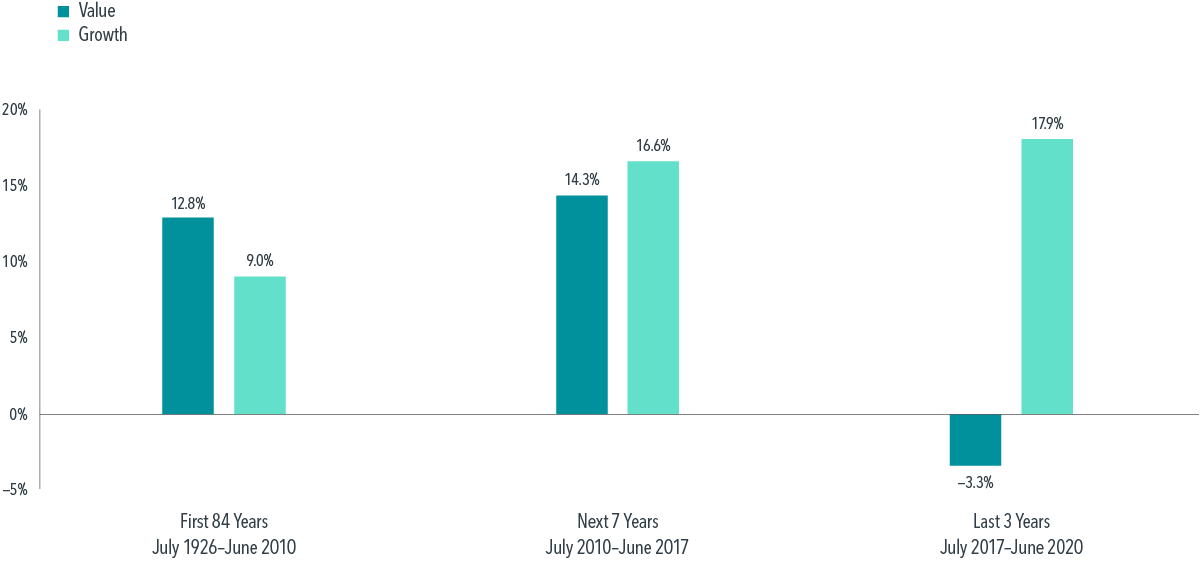
Tillväxtbolagens överlägsna avkastning (relativt till värde) senaste decenniet är något väldigt ovanligt.
Nope, inget bet eller spekulation om man är långsiktig, lika mycket investering som en marknadsviktad indexfond. Man kan t.o.m. hävda att det är mer ”bet” att bara investera i en riskfaktor (marknadsviktad indexfond, marknadsfaktorn) än att investera i multipla (SCV-viktad indexfond, marknads, storleks, värde och lönsamhetsfaktorn).
Dock bör man vara medveten om dom psykologiska utmaningarna att hålla något som avviker från breda marknaden, kan vara att tufft att gå mot strömmen.